

Using Expected Sacks and Pressure Rate to Identify Bounce Back and Regression EDGE Candidates in IDP Fantasy Football 2026
Use the data to get ahead of the market and more importantly, your league mates

Everyone knows I love linebackers, but sometimes, just sometimes, the defensive line needs some attention. The position has become a lot of fun to evaluate.
When fantasy managers draft edge rushers for IDP, they’re mostly buying last year’s sack column.
It’s like buying an RB or WR simply based on last season’s TD numbers. Those numbers aren’t sticky and riddled with variance.
Sacks are just a small part of the story. The others are opportunity (how many quality pass rush chances did a player actually see?) and process (is he winning his individual matchups?). Expected sacks answer the first question. Pressure rate and pressure volume answer the second. The third layer is consistency, which I measured here as CV (coefficient of variation of a player’s week-to-week standard deviation divided by his PPG average).
A low CV means a reliable floor; a high CV means boom-or-bust. When you stack all three against actual sack totals, you expose two groups that ADP consistently misprices every single year.
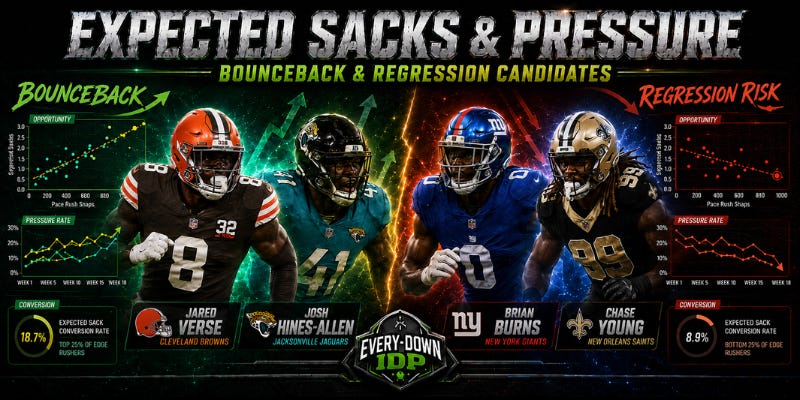
Group 1 — The Undervalued: Players generating elite-level opportunity and individual pressure but not converting to sacks. Counting stats look pedestrian. ADP drops. The model says buy.
Group 2 — The Overvalued: Players whose sack totals vastly outran what the opportunity and pressure data supported. They look like studs, the ADP climbs, however, process and data says sell.
The 2025 season validated this framework more clearly than any year in recent memory. Using a combination of data and film, I’ll identify some potential breakouts and edge rushers who could be in for some regression.
Note: The numbers take in account Weeks 1-17, which is typically, the fantasy football schedule.
Pass Rush Opportunities
The two charts below map every qualifying edge rusher from the 2025 season across two independent lenses. Read them together and they’re designed to confirm each other.
Chart 1 plots expected sack opportunity (horizontal) against finishing rate (vertical). Opportunity measures how often a player was in a position to generate a sack based on role, snap count, and pass rush alignment. Finishing measures how well he converted that opportunity relative to what the model projected. The bottom-right quadrant is the buy zone; elite opportunity, low conversion. The top-right is where regression risk lives. The distance between where a player sits and where his opportunity says he should be is the market inefficiency this article is built around.
Chart 2 is the second confirmation. It plots pressure rate:
How often a player wins his individual pass rush matchup against actual sacks.
The dashed line is the expected relationship between the two.
Players sitting above the line are cashing in maybe more than they've earned. Players below it are working harder than their sack total suggests.
When a player appears in the buy zone on Chart 1 and below the trend line on Chart 2, the same inefficiency is showing up through two independent data sources. I think that’s the data trying to get your attention like the truck signaling Lloyd to get out of his lane in Dumb and Dumber.
Colored dots represent the players covered in this analysis.The gray dots are the rest of the qualifying field. A full labeled reference chart with 50 edge rushers plotted.
Keep reading with a 7-day free trial
Subscribe to Mike Woellert's Every-Down IDP to keep reading this post and get 7 days of free access to the full post archives.